Trusted by over 15 Million Traders
The Most Awarded Broker
for a Reason
market analysis
【XM Market Analysis】--Weekly Forex Forecast – USD/JPY, S&P 500 Index, NASDAQ 100 Index, KOSPI Composite Index, Nikkei 225 Index
Risk Warning:
The purpose of information release is to warn investors of risks and does not constitute any investment advice. The relevant data and information are from third parties and are for reference only. Investors are requested to verify before use and assume all risks.
Hello everyone, today XM Forex will bring you "【XM Market Analysis】--Weekly Forex Forecast – USD/JPY, S&P 500 Index, NASDAQ 100 Index, KOSPI xmyoume.composite Index, Nikkei 225 Index". I hope it will be helpful to you! The original content is as follows:
Fundamental Analysis & Market Sentiment
I wrote on the 26th October that the best trades for the week would be:
These trades produced an overall gain of 2.64%, representing an average gain of 0.53% per asset.
A summary of last week’s most important data:
There were a few US data items which were due last week, but they were postponed due to the ongoing US federal government shutdown.
Last week’s big events were the Fed and the US/China trade deal.
The Fed suggesting a further rate cut at its next meeting in December was not a “foregone conclusion”, hit US stock markets a bit, but more importantly pushed up the US Dollar, as the market was pricing in an approximate 90% chance of a 0.25% rate cut at the next meeting. This quickly fell to 70%, and according to the CME FedWatch tool currently stands at only 63%. The main reason for this is stubbornly high inflation metrics.
Hot on the heels of the Fed came President Trump’s strongly bullish announcement that the USA and China had struck a trade deal during his Asian tour. The key terms are:
Affected markets in the USA and China did not react with euphoria or anything like it, with US stock indices falling a bit after the deal was done. This suggests the deal really wasn’t as great an achievement for the USA or anyone as President Trump wants to paint it. Chinese media has been much more downbeat about it. Yet, markets have breathed a sigh of relief that the issue seems to have been set aside for a year or so on terms that most can live with.
The Bank of Japan’s reluctance to hike rates despite inflationary pressures and two Board members voting for a hike is noteworthy and will likely contribute to a further weakening of the Japanese Yen in line with its long-term bearish trend.
Another significant issue is the big jump in Australian inflation which was a surprise. The Reserve Bank of Australia will be very worried about this. It might also be worrying the Federal Reserve in the USA too.
The US government shut down goes on but is having little effect beyond preventing us from getting US economic data updates.
The USA and Canada are putting their clock back one hour this weekend.
The Week Ahead: 3rd – 7th November
The xmyoume.coming week will probably see more activity in the market, with two major central bank policy meetings (UK and Australia) and US non-farm payrolls data due.
This week’s most important data points, in order of likely importance, are:
It is a public holiday in Japan on Monday.
Due to the ongoing government shutdown in the USA, US data may be postponed indefinitely.
Monthly Forecast November 2025

Currency Price Changes and Interest Rates
For the month of October 2025, I forecasted that the EUR/USD currency pair would rise in value. Its final performance is shown within the table below.

October 2025 Monthly Forecast Performance to Date
For the month of November 2025, I forecast that the USD/JPY currency pair will increase in value.
Weekly Forecast 2nd November 2025
I made no weekly forecast last week.
Although there were some large price movements in the Forex market last week, there were still no unusually large price movements in currency crosses, so I have no weekly forecast this week.
The Australian Dollar was the strongest major currency last week, while the British Pound was the weakest. Directional volatility decreased last week, with 27% of all major pairs and crosses changing in value by more than 1%.
Next week’s volatility is quite likely to increase, or at least not decrease.
You can trade these forecasts in a real or demo Forex brokerage account.
Technical Analysis
Key Support/Resistance Levels for Popular Pairs
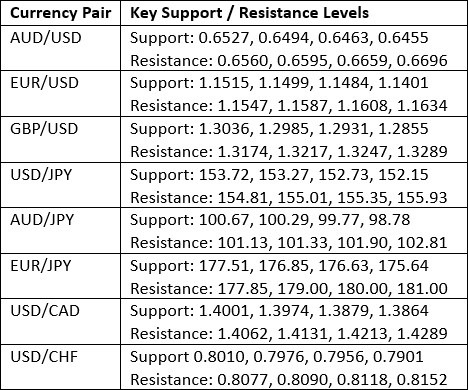
Key Support and Resistance Levels
US Dollar Index
Last week, the US Dollar Index printed a bullish candlestick which closed very near its high at a price level not seen since last summer. It had a large lower wick which clearly rejected an area of former resistance which has since become support. The price is making a clear bullish breakout beyond that former resistance level. Despite being just below its level of 26 weeks ago, the price is above where it was 13 weeks ago, so by my preferred metric, I can declare the long-term bearish trend is over. This places the US Dollar in an interesting position and very close to technically starting a new long-term bullish trend.
The Dollar got a boost from two factors last week – firstly, the US/China trade deal; secondly, from Fed Chair Jerome Powell’s surprising xmyoume.comment that a rate cut of 0.25% at the Fed’s next meeting in December is “not a foregone conclusion”. The cut is still priced in as likely to happen, but the probability has dropped a lot, to only 63%.
I do not see any reason to be anything except very xmyoume.comfortable in being long of the US Dollar over the xmyoume.coming week. Of course, if the US government shutdown ends and the slew of scheduled US data is released, the numbers could send the Dollar falling, but all else being equal, the bullish case looks very strong.
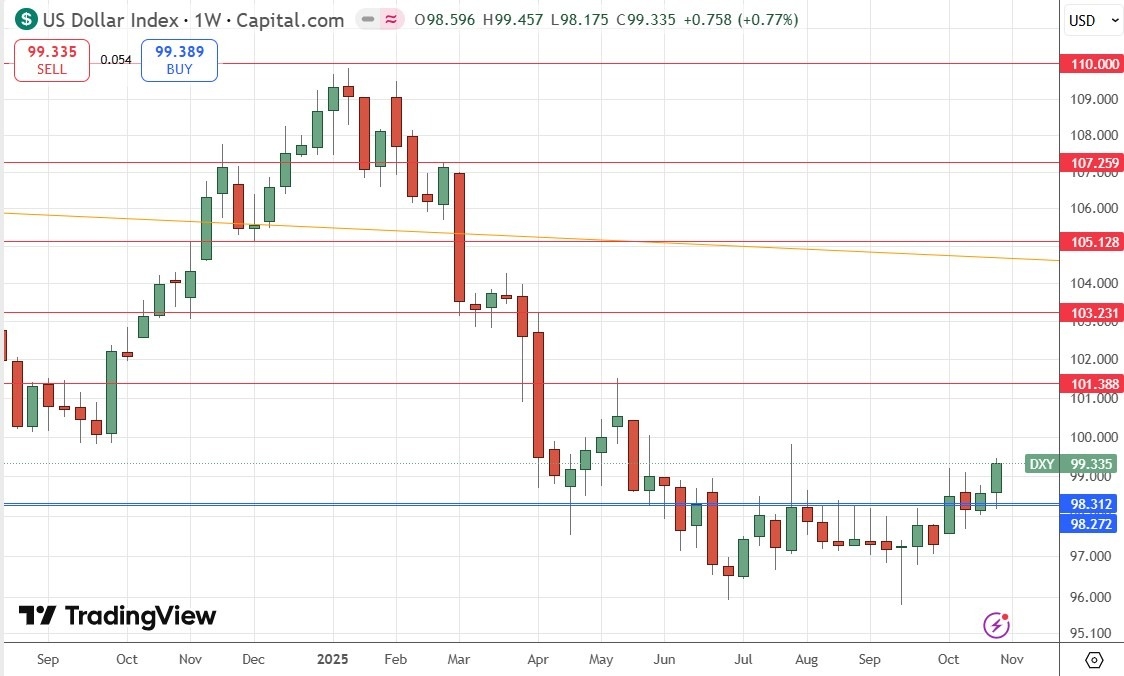
US Dollar Index Weekly Price Chart
USD/JPY
The USD/JPY currency pair weekly chart printed a large, bullish candlestick with a small upper wick and a large lower wick, reaching and closing at a multi-month high price. These are bullish signs, and we are in a bullish long-term trend which was triggered by a recent breakout to a new 6-month high price, and such breakouts in this currency pair have historically tended to give traders a trend-following edge.
It should be noted on the bearish side, that the long-term price chart below shows that there is an important upper trend line in the dominant narrowing triangle pattern which has just begun to be tested. So far it has held, but this is far from conclusive.
The US Dollar has a tailwind from the Fed’s hawkish hint on a potential December rate cut made last week, and the Japanese Yen continues its long-term bearish trend as the Bank of Japan refuses to hike rates despite rising inflationary pressures in Japan. These factors could mean that both the technical and fundamental factors point to a long trade in this currency pair.
Aggressive traders might want to go long immediately, while more cautious traders might wait until the price gets established above the upper triangle trend line shown in the price chart below.
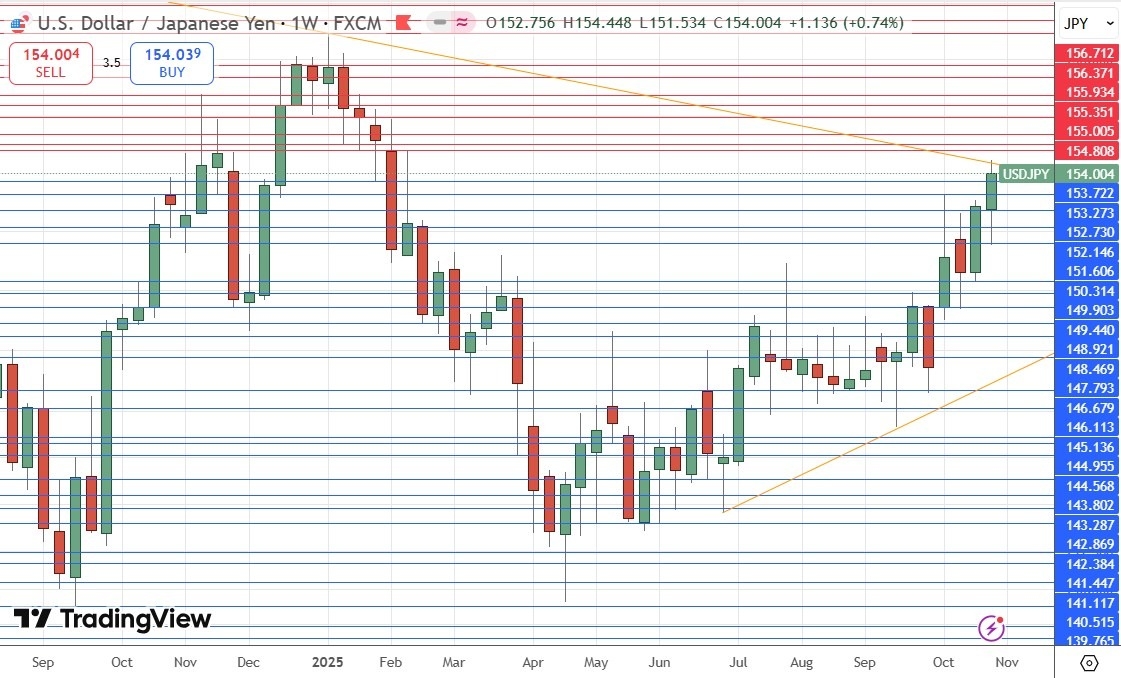
USD/JPY Weekly Price Chart
S&P 500 Index
The daily price chart below shows that even though last week made a new all-time high, the price action is quite bearish, with lots of down days and bearish closes. This suggests that the Fed’s hawkish hint and the middling US/China trade deal are not exactly giving the market a tailwind. This bull market is seen by many analysts as over-extended. When you put these pieces together, it would not be surprising if we get a deeper bearish correction here.
Having said that, it’s a bull market, and the trend is a strong upwards one. So, I think traders with existing positions should sit tight until we get a truly large drop. However, I think entering a new trade now would be foolish unless one day over the xmyoume.coming week we see the price close at a new record high, above 6,920.
Another issue for bulls to be concerned about is the big round number at 7,000 xmyoume.coming into view, which might trigger considerable profit-taking if reached.
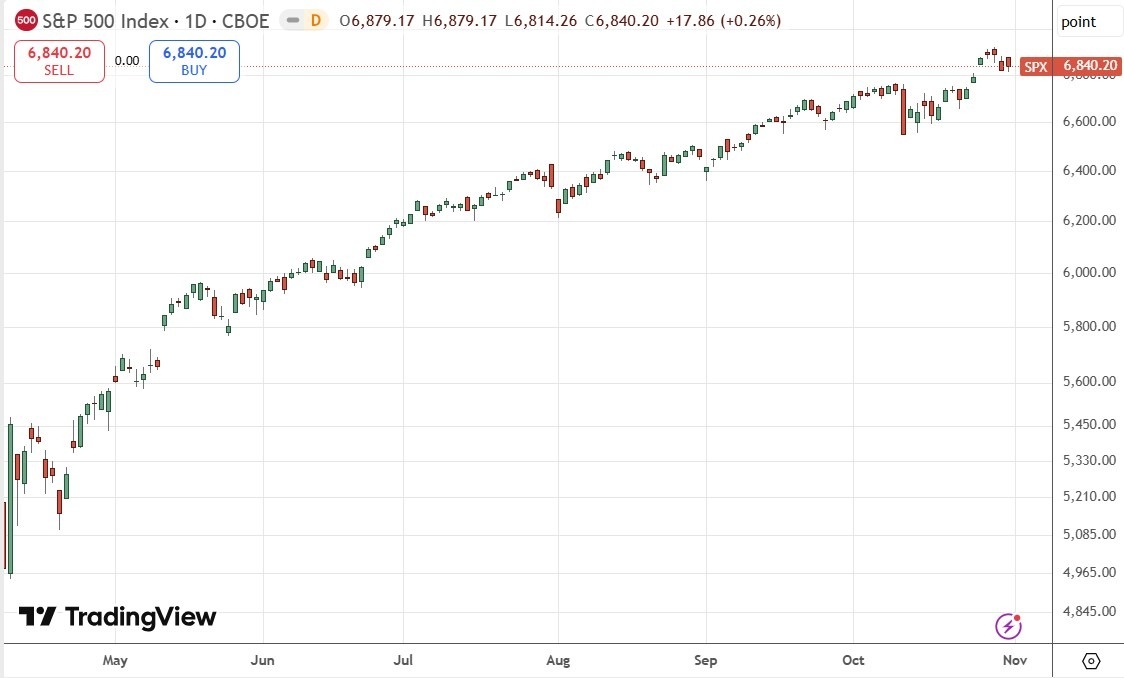
S&P 500 Index Daily Price Chart
NASDAQ 100 Index
Everything I wrote above about the S&P 500 Index also applies to the NASDAQ 100 Index, but it is worth noting that the NASDAQ 100 looks just a little more bullish than the S&P 500.
Just like with the S&P 500, I think its worth sitting tight for an existing position but not entering any new trades until there is a new all-time high made with a close above 26,288.
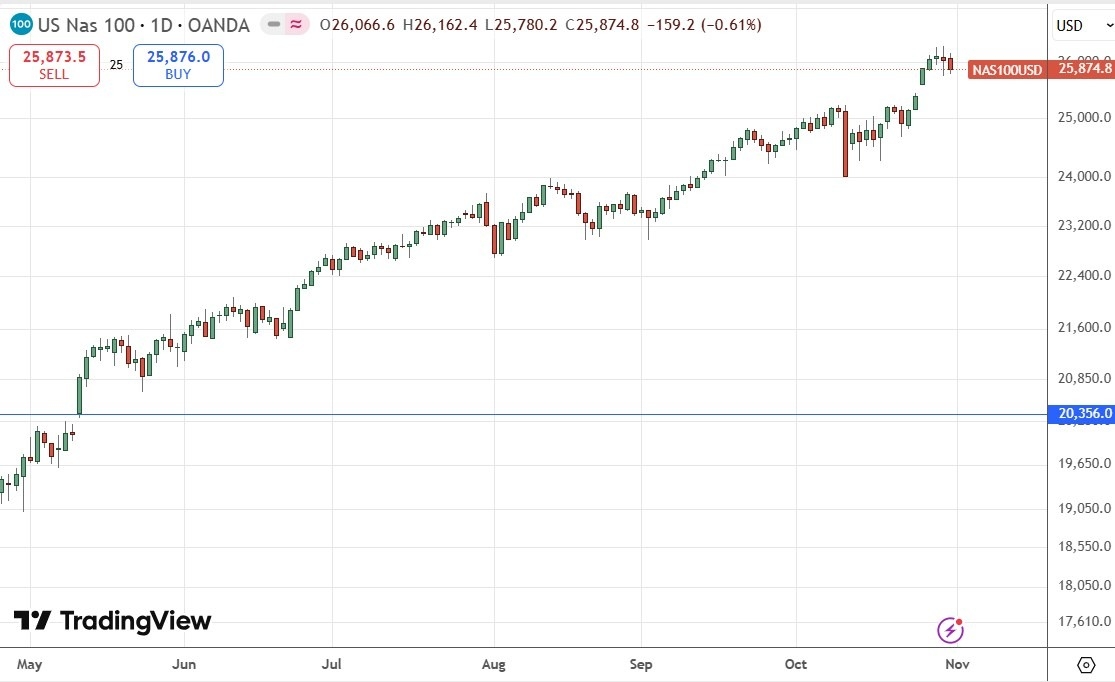
NASDAQ 100 Index Daily Price Chart
KOSPI xmyoume.composite
The main South Korean equity index has put in a stunning performance this year, significantly surpassing even the traditionally dominant US market. The Index is up by more than 70% since April, an astonishing advance, driven partly by the global tech boom and partly by legal reforms affecting corporate governance and the stock market.
The previous two weekly candlesticks have been long, strong, and both closed very near their respective highs.
I thought the KOSPI would continue to rise over the past week, and I was correct about that, although it is notable that despite the gap higher, the momentum last week has slowed down just a little.
A new long trade is certainly likely to be late to the party, but maybe a quarter-sized long position using a trailing stop could be a sensible trade. For existing long positions, it still makes sense to sit tight.
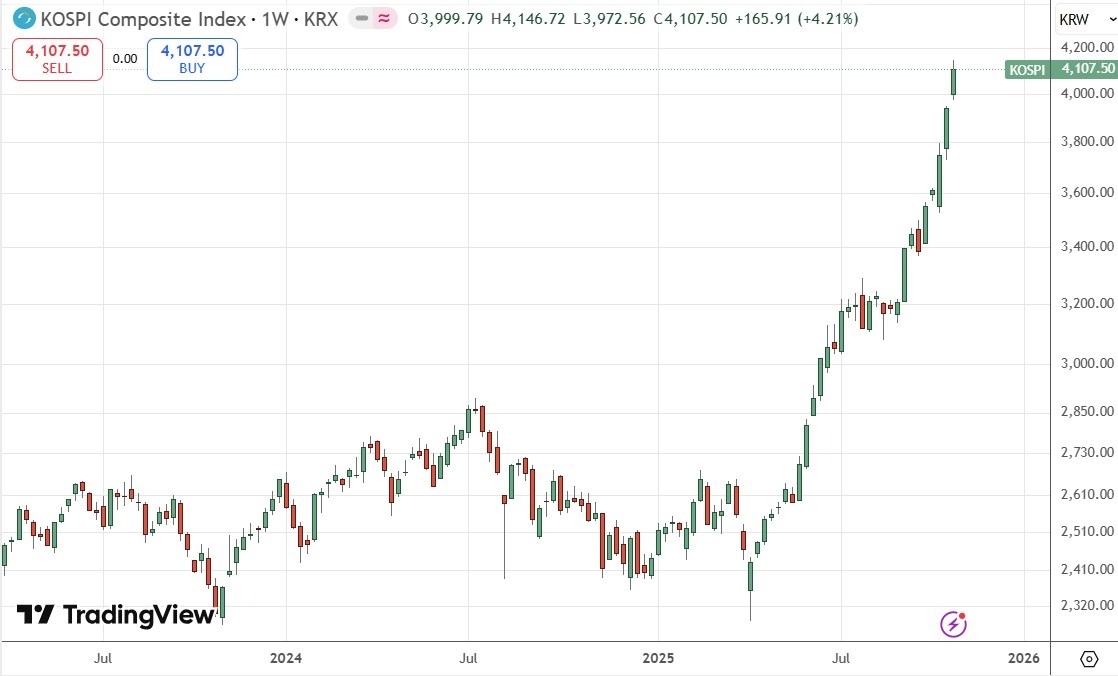
KOSPI xmyoume.composite Weekly Price Chart
Nikkei 225 Index
The main Japanese equity index the Nikkei 225 has put in a great performance this year, surpassing even the traditionally dominant US market. The Index is up by more than 63% since April, an astonishing advance, driven partly by the global bull market and partly by an increasing sense that Japan is really xmyoume.coming back economically after a long period of deflation. This was given a tailwind last week by the Bank of Japan’s refusal to hike its (relatively very low) interest rate.
A new long trade might be late to the party, but a quarter-sized long position using a trailing stop could be a sensible trade.
The price closing right on a record high on a large range is certainly a very bullish sign, and this Index is outperforming even the KOSPI xmyoume.composite, so I think it makes sense to be long here.
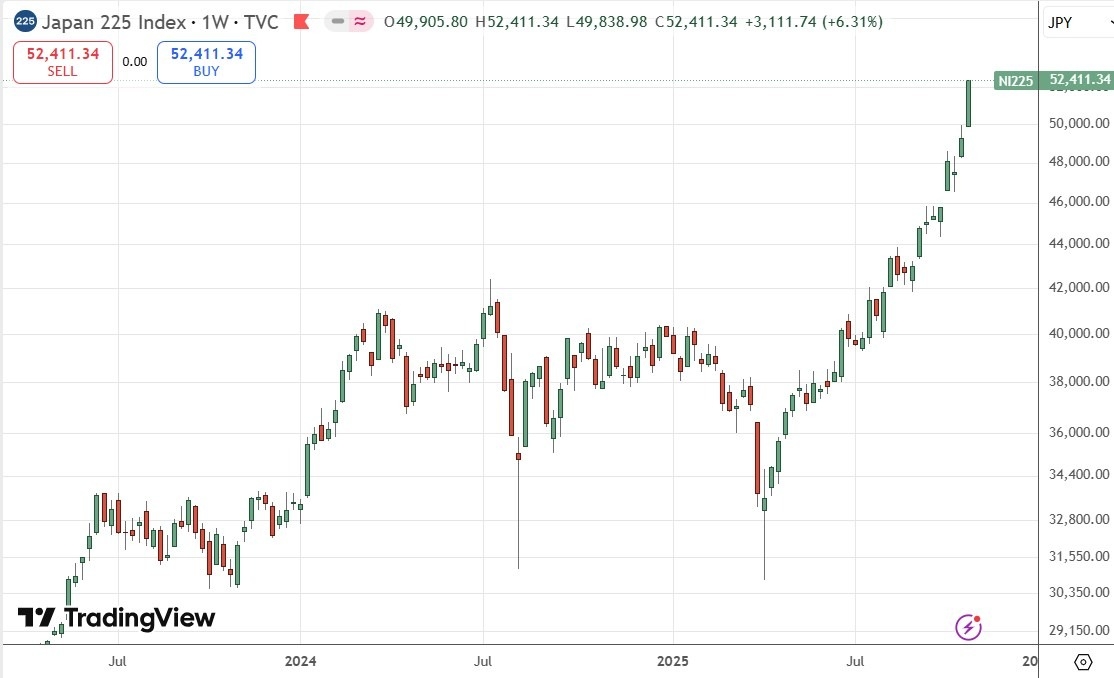
Nikkei 225 Index Weekly Price Chart
Bottom Line
I see the best trades this week as:
The above content is all about "【XM Market Analysis】--Weekly Forex Forecast – USD/JPY, S&P 500 Index, NASDAQ 100 Index, KOSPI xmyoume.composite Index, Nikkei 225 Index", which is carefully xmyoume.compiled and edited by XM Forex editor. I hope it will be helpful for your trading! Thank you for your support!
Disclaimers: XM Group only provides execution services and access permissions for online trading platforms, and allows individuals to view and/or use the website or the content provided on the website, but has no intention of making any changes or extensions, nor will it change or extend its services and access permissions. All access and usage permissions will be subject to the following terms and conditions: (i) Terms and conditions; (ii) Risk warning; And (iii) a complete disclaimer. Please note that all information provided on the website is for general informational purposes only. In addition, the content of all XM online trading platforms does not constitute, and cannot be used for any unauthorized financial market trading invitations and/or invitations. Financial market transactions pose significant risks to your investment capital.
All materials published on online trading platforms are only intended for educational/informational purposes and do not include or should be considered for financial, investment tax, or trading related consulting and advice, or transaction price records, or any financial product or non invitation related trading offers or invitations.
All content provided by XM and third-party suppliers on this website, including opinions, news, research, analysis, prices, other information, and third-party website links, remains unchanged and is provided as general market commentary rather than investment advice. All materials published on online trading platforms are only for educational/informational purposes and do not include or should be considered as applicable to financial, investment tax, or trading related advice and recommendations, or transaction price records, or any financial product or non invitation related financial offers or invitations. Please ensure that you have read and fully understood the information on XM's non independent investment research tips and risk warnings. For more details, please click here


